Child health in South Africa – June 2013 Part 1
- June 4th, 2013
- Posted in Child Health in South Africa
- Write comment
Here is the first part of a slide presentation given recently at a conference of family physicians and primary health doctors. It describes  the some of the health-impacting context in which many children are growing up in the country. You will find more detail in the reports given on each slide. Parts 2 sets out indicators of child health and Part 3 describes some ways of improving things, with a few things that individual clinicians can do right now.
Healthy children don’t just happen, and sick children are largely made sick. If we don’t work at it (and we now know a great deal about what work to do), sick children happen, and even those with unavoidable disabilities or long-term problems gets sicker than they needed to have been.
1In this lecture I intend to paint you a picture of the state of play in child health in South Africa – that is, where we are; the picture of a rosy future – a better road – that is “where we want to beâ€; and then a description of the vehicle or vehicles we might use to get there. And please pay attention because, if you are a primary health care Doctor or nurse or a child health worker, you are going to be on that journey, and not simply as a passenger, I hope and trust, because without primary health care clinicians on board the whole child health enterprise is sunk!
 2
More than any other members of the human race (apart perhaps from the very elderly), children are dependent on their environment; they are
vulnerable to or they are protected by the context in which they live and grow up from before they are born. So here are some aspects of the South African context in which children are growing up.
This pagoda-like picture is the South African population by age group with youngest at the bottom and oldest at the top from the 2011 census. As a population, we are gradually ageing with a median age that has risen from 22 to 25 over the last six years, but we are still very young. Of our 50 million or so members, more than 18½ million are children under 18, and as you can see from the pyramid, many of them are very, very young. A disproportionate number of young children is in the black African population. You will see why this is important for us to note as we go on.
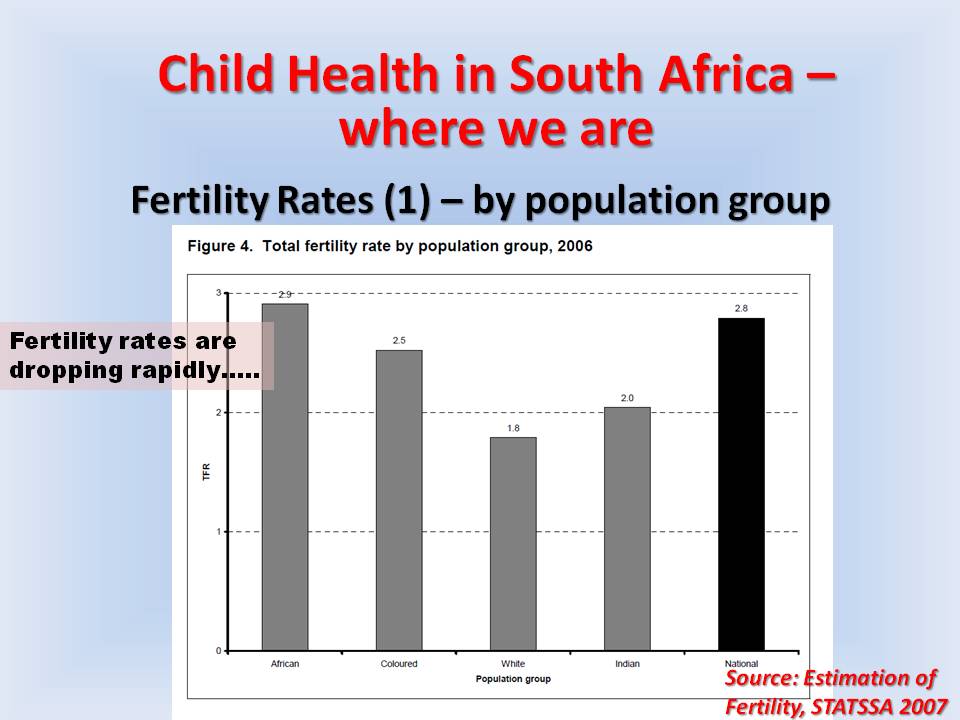
So where did the children come from? Well, they come from women who become pregnant, don’t say? Fertility rates are dropping quite fast, and the most recent estimate shown here is a 2.8 children per woman. But if we look at the context of fertility rates by population group in South Africa, we see that these are very variable – high in black African, replacement level in white –
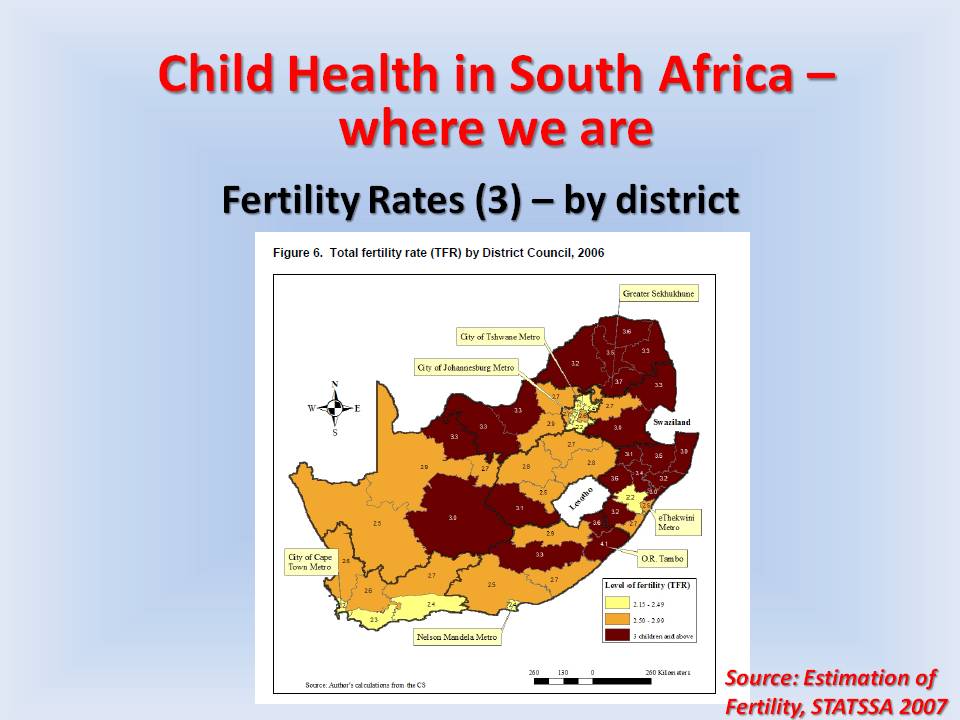
…and also by province. This reflects somewhat how the socio—economic groups are situated but shows that are many children a woman has a different parts of the country differs. Note here and the next slide –
…how living in a largely urban province produces low fertility rates. To a large extent, a woman has fewer reproductive choices in these high fertility areas. This increases pregnancy risk and therefore affects fetal, neonatal and child outcomes, as we know.
7
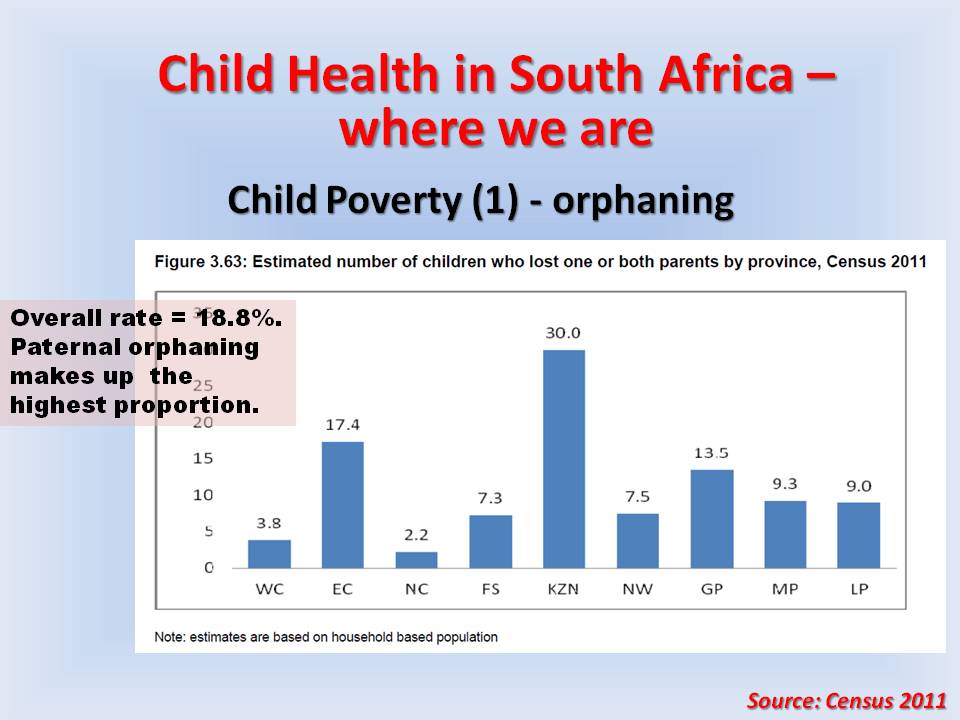
When we look at the children themselves, we find that many are not living with their parents, and, in many cases, this is because their parents or one parent is not alive. We know that the situation significantly increase the risk of poor health for children. It also reminds us in the clinical setting that the woman who comes with a child is in many cases not the child’s mother. It’s a good idea to ask. It comes as something of a shock that nearly one in three children in KwaZulu Natal has lost one or both parents.
8
These graphs which come from Children Count project of the Children’s Institute of the University of Cape Town and published in the South African Child  Gauge last year. The position in each province is shown for 2003 (brown) and 2010 (blue). The bars show changes in absolute level of income poverty defined as living on household income of less than 575 rand a month. Hearteningly levels of child poverty are dropping; however in some provinces more than 70% of children are living in poverty and the level of poverty for children is higher than it is for adults all over the country.
9
When looked at through the lens of food security, we see general improvements here as well, though an inexplicable change for the worse in the Northern Cape. But significantly, any children in South Africa (about one in six) are still experiencing hunger regularly. I wonder if anybody can explain why these improvements might have taken place, given that circumstances such as unemployment are not shifting downwards to any significant degree? 3 letters C and S and G….
10
Looked at from another perspective, we find that children are not living in very good housing in many respects. This is not shifted between 2002 and 2010, and about 2 million children are living in backyards or informal homes. Again, as a proportion, living in poor housing is higher than for adults. The two letters T and B ought to be firing of in our brains, – and letters A, R and I.
11
And what is it like in terms of access to basic services like water and sanitation? Well, it is very good if you live in an urban-predominant province and it is improving overall, but there are still large numbers of children in this country who do not have access to safe water and safe sanitation. You don’t need me to tell you that this has significant health implications for young children. The letters D and D come to mind.
12
And looked at from the point of view of multiple deprivation (which I’m heartened to have discovered is being used by the Department of Health to decide where to focus their municipal Ward-based community teams which will be talking about later), you will see that the areas in dark blue of multiple deprivation coincide rather neatly and depressingly with a map that we may remember from the 1970s and 1980s. Yes, the former homelands are still the areas where children are living in dire circumstances with implications for the health indicators we will see in a moment.
So if you are a child – especially very young child – there is a more than average chance that you will live in an environment that promotes your becoming sick, an environment that will also make you more sick if you do get sick. What is more this environment militates against optimal management of your chronic illness or disability if you have one – and you’re more likely to have one because of your environment. You will also live in an environment that makes it more difficult for you to access healthcare.Go to Part 2